This is the blog section. It has two categories: News and Releases.
Files in these directories will be listed in reverse chronological order.
This is the multi-page printable view of this section. Click here to print.
This is the blog section. It has two categories: News and Releases.
Files in these directories will be listed in reverse chronological order.
It’s never been easy for a developer to get started in Common Lisp. Emacs, though a powerful editor, isn’t considered an IDE by modern standards. Setting up a compiler, quicklisp, slime, swank, and then learning an entirely new programming paradigm has scared off many would-be entrants to the Common Lisp community.
Given the size of the Common Lisp community this is understandable. Making the new user experience smooth and frictionless as possible is hard work. It’s the kind of work that no one volunteers for; it’s the kind of work you have to be paid for.
Still, it’s a pre-requisite for new users, so I’ve created ls-dev-image, a ‘batteries included’ OCI image for Lisp-Stat or just plain Common Lisp development. Assuming you have an OCI (e.g Docker) runtime installed. Here’s how to get started.
docker run --rm -it --user vscode -w /home/vscode ghcr.io/lisp-stat/ls-dev:latest bash
Now you’re in the container with a bash shell and can configure the machine as you like.
If you want a Common Lisp REPL:
docker run --rm -it --user vscode -w /home/vscode ghcr.io/lisp-stat/ls-dev:latest ls-repl
and you should see:
Linedit version 0.17.6, smart mode, ESC-h for help.
CL-USER(1):
You could also have gotten here from the shell with the sbcl command. This is a bare common lisp image, with nothing loaded. Now you load lisp-stat from the Quicklisp repositories with:
(ql:quickload :lisp-stat)
... lot's of compilation output ...
[package ls-user]
(:LISP-STAT)
CL-USER(2):
and to start working with Lisp-Stat:
(in-package :ls-user
This REPL has been configured with a few packages to make it easier to work with.
:cs for compile-system, :ts for test-system, etc.Generally you won’t be doing development with the REPL, you’ll be doing it in emacs.
Now you can use Common Lisp with emacs, quicklisp and slime. From the shell you can type ’emacs’ followed by ‘M-x slime’ and start hacking Common Lisp.
The upstream repositories are often out of date. To get the latest and to keep them synced you can use the init.sh script with ls-init.sh --mode experimenter. Experimenter will download the repos so you can try out the source code, but you won’t be able to push your changes or make pull requests. For that you want to be a ‘contributor’: ls-init.sh --mode contributor.
Now when you start ls-repl you should see the lisp-stat REPL prompt, indicating you’re in the LS-USER package:
ls-init.sh --mode experimenter
# ... output from repo checkouts, linking, configuration
ls-repl
lot’s of recompilation because you’re now using local source repos and then:
...
To load "ls-server":
  Load 1 ASDF system:
    ls-server
; Loading "ls-server"
.....

Linedit version 0.17.6, smart mode, ESC-h for help.
LS-USER(1):
From here emacs and M-x slime (from the shell) will load Lisp-Stat.
A ls-server is also configured to start automatically on port 20202. If you open your browser and point it to https://localhost:20202 (or other port, depending on your OCI container configuration) you’ll see the web interface for displaying plots and viewing/editing data-frames.
You can also run this OCI image in GitHub codespaces.
You will want to run docker pull occasionally to get the latest ls-dev-image. This should stabilize in a month or so and after that it won’t need to be updated frequently. To keep lisp-stat source in sync, run ls-init.sh --refresh. If you want help with ls-init.sh, run ls-init.sh --help.
Contributions and bug reports are welcome and encouraged.
We started the year by working through the examples from the first chapter of the Introduction to the Practice of Statistics. Whilst this is an excellent test for Lisp-Stat, Chapter 2 presented some major challanges to the plotting system, so the highlight for this year is Plot 2.0. This is a breaking change, however the fix for plots is relatively simple.
The updates for 2023 include:
The examples from the first chapter of the book are now completed. This chapter focuses mostly on graphics, and the examples here supplement those in the plotting examples.
Lisp-Stat is the culmination of many months work to pull together the best-in-class statistical analysis packages available in Common Lisp, under a commercially friendly license, usable ‘out of the box’. It is an environment for statistical computing, conceptually similar to R, that is also suitable for front-line production deployments. It grew out of a desire to have an environment for rapidly prototyping analytical and A.I. solutions, and move directly to production environments with minimal friction. Typically there is a gap between the modeling environment, perhaps R or Python, and the delivery environment. Lisp-Stat closes that gap.
Lisp-Stat is in daily use for statistical analysis and is now considered ready for a broader audience.
We had a few requirements when evaluating options. Specifically the system had to:
Common Lisp was the only framework that met all these requirements. And, it is not the first time lisp has been used in a statistical setting. XLISP-STAT, our spiritual predecessor, was a contemporary of R in the early days of development. Wikipedia says about it: “XLispStat was historically influential in the field of statistical visualization” and its author, Luke Tierney, was a member of the original R core team.
Lisp-Stat provides support for vectorized mathematical operations, a super-set of common lisp array operations, and a comprehensive set of statistical methods that are implemented using the latest numerical algorithms. In addition, Common Lisp provides a dynamic programming environment that includes a REPL for interactive evaluation of code, CLOS, an excellent object oriented environment and a meta-object protocol (MOP).
We have also compiled an archive of XLISP-STAT libraries that can be ported with the aid of a compatibility package (XLS). This gives Lisp-Stat a leg up on ecosystem development; there are many useful statistical routines in the archive.
If you are familiar with R, and want to understand how to do similar things with Lisp-Stat, the basic tutorial is the place to begin. If you have a Common Lisp installation and want give Lisp-Stat a quick try, start with Install to Plot in 5 minutes. For newcomers to lisp, see the Installation section for how to get going from ground zero.
All the basics for descriptive statistical analysis.
Load the classic R mtcars data set into a data frame:
(data :mtcars)
The plotting examples show how to plot the horsepower vs. miles-per-gallon of the similar Vega-Lite data set:
(plot:plot
  (vega:defplot hp-mpg
  `(:title "Horsepower vs. MPG"
    :data (:values ,vgcars)
    :mark :point
	:encoding (:x (:field :horsepower :type :quantitative)
	           :y (:field :miles-per-gallon :type :quantitative)))))
For reproducible research and sharing.
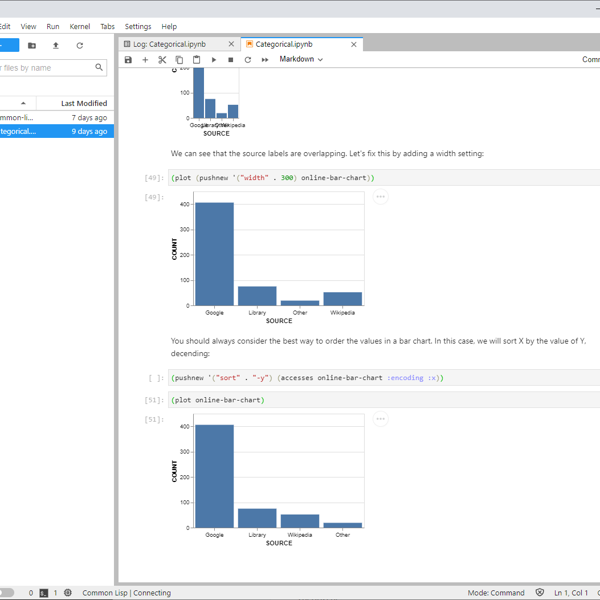
Lisp-Stat running in a Jupyter-Lab notebook
The examples show how to create commonly used statistical plots and the analytic examples work through the examples of the book Introduction to the Practice of Statistics using Lisp-Stat.
About 1500 R data sets can be
loaded using the rdata package.
The community page page describes how the project is structured. Help can be obtained from:
Several of these libraries are based on the work of Tamas K
Papp, who was working as a practicing
econometrician using Common Lisp before leaving the community for
Julia. One of the design goals for Lisp-Stat was to avoid the Lisp
Curse that
plagues so many common lisp niches, including statistics. So, rather
than reinvent the wheel, we took some existing wheels, greased and
polished them, added documentation and filed off the rough edges to
make them work smoothly together in an integrated environment. The
greenfield work includes special functions and plot.
You may have. In late March 2021 existence of Lisp-Stat was leaked to Hacker News and Reddit. At that time, we were still getting Lisp-Stat ready for general release, and things were not quite where we wanted them to be. If you saw the original leaked version, here are the changes:
Today we’re releasing quick-plot, a new system for Lisp-Stat that bring ggplot2-style composable plotting to Common Lisp. plot/vega is able to render any Vega-Lite specification (here’s 50 examples), but it can at times be a bit wordy constructing the nested plists by hand.
Instead of specifying each plot in detail, quick-plot provides a set of helper functions that work similarly to geom in ggplot. Essentially we borrow ggplot’s concept of a plot as a composition of independent layers (which is what Vega-Lite does anyway), each with one concern:
| Function | Package | Responsibility |
|---|---|---|
point |
geom |
Scatter plot mark & encoding |
bar |
geom |
Bar chart mark & encoding |
histogram |
geom |
Binned distribution |
box-plot |
geom |
Summary statistics |
line |
geom |
Line chart mark & encoding |
label |
gg |
Axis titles |
axes |
gg |
Scales, transforms, domains |
coord |
gg |
Viewport clipping |
theme |
gg |
Dimensions, fonts, style |
tooltip |
gg |
Hover details |
Each function returns a plist fragment. A recursive merge-plists
combines them into a single Vega-Lite spec. A mark function never
sets axis titles; label never touches encodings; theme never
alters mark types. You can add, remove, or swap any layer without
affecting the others.
Setup environment:
(asdf:load-system :quick-plot)
(vega:load-vega-examples)

(import '(geom:point geom:bar geom:histogram geom:box-plot geom:line))
(import '(gg:label gg:axes gg:coord gg:theme gg:tooltip))
(import '(qplot:qplot))
The simplest scatter plot needs just a name, a data frame, and two field names:
(qplot 'cars-basic vgcars
  `(:title "Horsepower vs. MPG")
   (point :horsepower :miles-per-gallon))
Scatter plot with labels:
(qplot 'blog-labels vgcars
  `(:title "Vega Cars")
   (point :horsepower :miles-per-gallon :filled t)
   (label :x "Engine Horsepower" :y "Fuel Efficiency (MPG)"))
Now you can add size of the point to encode some data, along with color:
(qplot 'cars-bubble vgcars
  `(:title "Bubble: Size = Acceleration")
   (point :horsepower :miles-per-gallon
          :color :origin :size :acceleration
          :filled t)
   (label :x "Horsepower" :y "Miles per Gallon"))
See the quick-plot cookbook for recipes for some common plot types.
This release is the third major refactoring of Lisp-Stat, with particular emphasis on plotting. I have attempted to make plotting as easy in Lisp-Stat as it is in Vega-Lite, upon which it is based. In addition, much clean-up and polishing of sharp edges has taken place as a result of using Lisp-Stat on real-world projects.
As always, comments and contributions are welcome.
(data :mtcars). The mechanism is extensible for
add on packages to use as well.(asdf:load-system :plot/vega)
(data :vgcars)
(plot:plot
(vega:defplot hp-mpg
`(:title "Horsepower vs. MPG"
:data (:values ,vgcars)
:mark :point
:encoding (:x (:field vgcars:horsepower)
:y (:field vgcars:miles-per-gallon)))))
filter-rows, remove-columns, remove-columns! and rename-column!.categorical (factor) and temporal.stack, split-apply-combine, sort operations.Array operations has been rehomed and now lives in the Lisp-Stat github organisation. Significant improvements to documentation over the previous repository.
There probably isn’t a part of the documentation that hasn’t been touched. Improvements in all areas, including organisation, expanded topic coverage and quality improvements.
Previously Lisp-Stat used semantic versioning appropiate for binary patch distribution. In this scheme the major number indicates whether or not the lisp image needed to be cold started, and a minor version indicating if a patch could be applied. Since it’s unlikely we’ll have a viable patching system in the open source Common Lisp world anytime soon, we’ve moved to semantic versioning for source releases. Since the semantics of versioning are different, all systems have been reset to 1.0.0. Going forward we’ll use the major.minor.patch scheme.