Plotting
Overview
The plot system provides a way to generate specifications for
plotting applications. Examples of plotting packages include
gnuplot, plotly and
vega/vega-lite.
Plot includes a back end for Vega-Lite; this tutorial will teach you
how to encode Vega-Lite plot specifications using Common Lisp. For
help on Vega-Lite, see the Vega-Lite
tutorials.
For the most part, you can transcribe a Vega-Lite specification directly into Common Lisp and adapt it for your own plots.
Preliminaries
Load Vega-Lite
Load Vega-Lite and network libraries:
(asdf:load-system :plot/vega)
and change to the Lisp-Stat user package:
(in-package :ls-user)
Load example data
The examples in this section use the vega-lite data sets. Load them all now:
(vega:load-vega-examples)
Note
If you get an error related tocl-date-time-parser or chroncity (only seen on Allegro Common Lisp), then load them manually with (ql:quickload :cl-date-time-parser) and (ql:quickload :chronicity) and re-run (vega:load-vega-examples)
Anatomy of a spec
Plot takes advantage of the fact that Vega-Lite’s JSON specification
is very close to that of a plist. If you are familiar with Common
Lisp’s ASDF system, then you will be familiar with plot’s way of
specifying graphics (plot was modeled on ASDF).
Let’s look at a Vega-Lite scatterplot example:
{
  "$schema": "https://vega.github.io/schema/vega-lite/v5.json",
  "description": "A scatterplot showing horsepower and miles per gallons for various cars.",
  "data": {"url": "data/cars.json"},
  "mark": "point",
  "encoding": {
    "x": {"field": "Horsepower", "type": "quantitative"},
    "y": {"field": "Miles_per_Gallon", "type": "quantitative"}
  }
}
and compare it with the equivalent Lisp-Stat version:
(plot:plot
  (vega:defplot hp-mpg
  `(:title "Vega Cars Horsepower vs. MPG"
    :description "Horsepower vs miles per gallon for various cars"
    :data (:values ,vgcars)
    :mark :point
	:encoding (:x (:field :horsepower :type :quantitative)
	           :y (:field :miles-per-gallon :type :quantitative)))))
Note that in the Lisp-Stat version we are embedding the data
using the :values keyword, as opposed to obtaining it from a server
with :url. You can try plotting this now: click on the copy button
in the upper right corner of the code box and paste it into the REPL.
You should see a window open with the plot displayed:
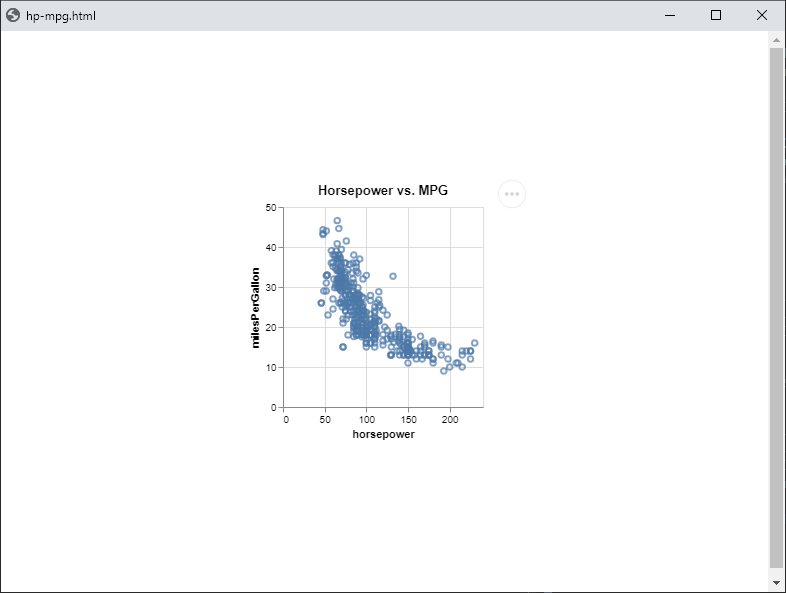
Your first plot
Data sources
The data property
tells Vega where the data for the plot is. Most, but not all,
specifications have a single, top level data property, e.g.
"data": {"url": "data/cars.json"}
Lisp-Stat allows you to use a data-frame, or data-frame
transformation (filter, selection, etc) as the value for the
data property. For example, since a data-frame transformation
returns a data-frame, we can insert the results as the data value,
as in this plot of residuals:
(:data (:values ,(filter-rows imdb
                              '(and (not (eql imdb-rating :na))
	                                (lt:timestamp< release-date
				                      (lt:parse-timestring "2019-01-01"))))
 :transform #((:joinaggregate #((:op :mean
	                             :field :imdb-rating
				                 :as :average-rating)))
where we remove :NA and any release-date after 2018.
Vega has
transformations
as well, but are a bit clumsy compared to those in Lisp-Stat.
Sometimes though, you’ll need them because a particular transformation
is not something you want to do to your data-frame. You can mix
transformations in a single plot, as we saw above in the residuals
plot, where the filtering was done in your data-frame and the
transformation was done in vega-lite.
Below are several examples of the hp-mpg plot, using various data sources:
Embedded
Most of the examples in this documentation use embedded data, where the data is a part of the plot specification. For completeness sake, we repeat an example here:
(plot:plot
  (vega:defplot hp-mpg
  `(:title "Vega Cars Horsepower vs. MPG"
    :description "Horsepower vs miles per gallon for various cars"
    :data (:values ,vgcars)
    :mark :point
	:encoding (:x (:field :horsepower :type :quantitative)
	           :y (:field :miles-per-gallon :type :quantitative)))))
URL
Note in this example we do not use a data frame as a source, therefore we have to specify field encodings as strings, since variable names will not have been converted to idiomatic lisp. E.g. Miles_per_Gallon vs miles-per-gallon.
(plot:plot
  (vega:defplot hp-mpg
    `(:title "Horsepower vs. MPG"
      :description "Horsepower vs miles per gallon for various cars"
      :data (:url "https://raw.githubusercontent.com/vega/vega-datasets/next/data/cars.json")
      :mark :point
      :encoding (:x (:field "Horsepower" :type :quantitative)
	             :y (:field "Miles_per_Gallon" :type :quantitative)))))
In a production environment, you may have several quri data sources in your image. To load from one of these:
(plot:plot
  (vega:defplot hp-mpg
    `(:title "Horsepower vs. MPG"
      :description "Horsepower vs miles per gallon for various cars"
      :data (:url ,(quri:uri "https://raw.githubusercontent.com/vega/vega-datasets/next/data/cars.json"))
      :mark :point
      :encoding (:x (:field "Horsepower" :type :quantitative)
	             :y (:field "Miles_per_Gallon" :type :quantitative)))))
Here we create the quri object at the same time, since it’s a stand-alone example. It would probably already be created in an actual use case.
Named data
Vega has named data sources that are useful if you have to refer to the same data in several places. We can create one like this:
(plot:plot
  (vega:defplot hp-mpg
    `(:title "Horsepower vs. MPG"
      :description "Horsepower vs miles per gallon for various cars"
      :datasets (:my-data ,vgcars)
      :data (:name :my-data)
      :mark :point
      :encoding (:x (:field :horsepower :type :quantitative)
	             :y (:field :miles-per-gallon :type :quantitative)))))
Plot specifications
Lisp in a spec
A plot specification is a plist. A nested plist to be exact
(or, perhaps more correctly, a tree). This means that we can use
Common Lisp tree/list functions to manipulate it.
If you look carefully at the examples, you’ll note they use a
backquote
(`) instead of a normal list quote ('). This is the mechanism
that Common Lisp
macros use to
rewrite code before compilation, and we can use the same mechanism to
rewrite our Vega-Lite specifications before encoding them.
The simplest, and most common, feature is insertion, like we did
above. By placing a comma (,) before the name of the data frame, we
told the backquote system to insert the value of the data frame
instead of the symbol (vgcars) in the example.
There’s a lot more you can do with the backquote mechanism. We won’t say any more here, as it’s mostly a topic for advanced users. It’s important for you to know it’s there though.
Properties
properties are the keys in key/value pairs. This is true whether
discussing a plist or JSON specification. Vega-Lite is case
sensitive and Common Lisp is not, so there are a few rules you need to
be aware of when constructing plot specifications.
Keys vs. values
Plot uses yason to transform a
plist plot specification to JSON. When yason encodes a spec
there are two functions of importance:
*symbol-encoder**symbol-key-encoder*
The former encodes values, and the latter encodes keys. In
PLOT, both of these are bound to a custom function
encode-symbol-as-metadata. This function does more than just encode
meta data though, it also handles naming conventions.
This won’t mean much in your day-to-day use of the system, but you do need to be aware of the difference between encoding a key and a value. There are some values that the encoder can’t work with, and in those cases you’ll need to use text.
Finally, remember that the symbol encoders are just a convenience to make things more lisp-like. You can build a plot specification, both keys and values, entirely from text if you wish.
Encoding symbols
JavaScript identifiers are incompatible with Common Lisp identifiers,
so we need a way to translate between them. plot uses Parenscript
symbol
conversion
for this. This is one of the reasons for specialised symbol encoders.
Let’s look at the difference between the standard yason encoder and
the one provided by plot (Parenscript):
LS-USER> (ps:symbol-to-js-string :x-offset)
"xOffset"
LS-USER> (yason:encode-symbol-as-lowercase :x-offset)
"x-offset"
LS-USER>
That difference is significant to Vega-Lite, where identifiers with a
- are not allowed. Vega is also case sensitive, so if a key is
xOffset, xoffset will not work. Fortunately Parenscript’s symbol
conversion is just what we need. It will automatically capitalise the
words following a dash, so x-offset becomes xOffset.
Symbols can also be used for value fields, and these are more forgiving. As long as you are consistent, and keep in mind that a behind the scenes conversion is happening, you can use lisp-like identifiers. Where this mostly comes into play is when you are using Vega transforms, as in the residuals example:
(:data ,(filter-rows imdb '(and (not (eql imdb-rating :na))
				                (lt:timestamp<
								      release-date
				                      (lt:parse-timestring "2019-01-01"))))
 :transform #((:joinaggregate #((:op :mean
	                             :field :imdb-rating
				                 :as :average-rating)))
             (:calculate "datum['imdbRating'] - datum.averageRating"
		      :as :rating-delta))
Notice that we used :imdb-rating as the field name for the
joinaggregate, however in the calculate part of the transform we
used the converted name imdbRating; that’s because by the time the
transform is run, the conversion will have already happened. When we
use :as we are assigning a name, when we use datum, we are
telling Vega to find a name, and since this is done in a text
field, plot won’t convert the names it finds inside text strings.
Finally, remember that the Parenscript transformation is also run on
variable/column names. You can see that we referred to imdb-rating
in the filter. If you get confused, run (keys <data-frame>) and
think about how ps:symbol-to-js-string would return the keys.
That’s what Vega will use as the column names.
This is more complicated to explain than to use. See the examples for best practice patterns. You’ll probably only need to be aware of this when doing transforms in Vega.
Variable symbols
When you define a data frame using the defdf macro, Lisp-Stat sets
up an environment for that data set. Part of that environment
includes configuring a package with a symbol for each variable in the
data set. These symbols have properties that describe the variable,
such as unit, label, type, etc. plot can make use of this
information when creating plots. Here’s a previous example, where we
do not use variable symbols:
(plot:plot
  (vega:defplot hp-mpg-plot
  `(:title "Vega Cars"
    :data (:values ,vgcars)
    :mark :point
	:encoding (:x (:field :horsepower :type :quantitative)
	           :y (:field :miles-per-gallon :type :quantitative)))))
and one where we do:
(plot:plot
  (vega:defplot hp-mpg-plot
  `(:title "Vega Cars"
    :data ,vgcars
    :mark :point
    :encoding (:x (:field vgcars:horsepower)
	           :y (:field vgcars:miles-per-gallon)))))
The difference is subtle, but this can save some typing if you are always adding titles and field types. We don’t use this in the examples because we want to demonstrate the lowest common denominator, but in all plots we create professionally we use variable symbols.
Special characters
There are occasions when neither the Parenscript encoder nor Yason
will correctly encode a key or value. In those situations, you’ll
need to use text strings. This can happen when Vega wants an encoding
that includes a character that is a reader macro, #, often used in
color specifications, or in format properties, like this one
(:format ".1~%")
Finally, there may be times when you need to use multiple escape
characters
instead of quoted strings. Occasionally an imported data set will
include parenthesis (). The data-frame reader will enclose these
in multiple escape characters, so for example a variable named body mass (g) will be loaded as |BODY-MASS-(G)|. In these cases you can
either change the name to a valid Common Lisp identifier using
rename-column!, or refer to the variable using the multiple escape
characters.
nil, null, false, true
Strictly speaking, false in JavaScript is the Boolean negative. In
practice, "false", a string, is often accepted. This seems to vary
within Vega-Lite. Some parts accept "false", others do not. The
plot symbol encoder will correctly output false for the symbol
:false, and you should use that anywhere you encounter a Boolean
negative.
true is encoded for the lisp symbol T.
nil and null may be entered directly as they are and will be
correctly transcribed.
Embedded data
By default, plot embeds data within the Vega-Lite JSON spec, then
uses vega-embed to display it
within an HTML page. The alternative is to use data from a
url. Both are
mostly equivalent, however there can be differences in parsing,
especially with dates. When data is embedded, values are parsed by
the JavaScript parser in your browser. When it’s loaded via a url,
it’s run through the Vega-Lite parser. Sometimes Vega-Lite needs a
bit of help by way
of format for
embedded data. For this reason plot always outputs dates & times in
ISO-8601 format, which works everywhere.
Large data sets can be problematic if you have a number of plots open and limited memory.
Saving plots
You can save plot specifications like any other Common Lisp object,
for example using with-open-file. data-frames also have read/write
functions. This section describes some convenience functions for plot
I/O.
Devices
A ‘device’ is a loose abstraction for the various locations that data
and specifications can be written to. For example in developing this
website, data is written to a directory for static files
/static/data/, and the plot specification to /static/plots/. We
can model this with a plist like so:
(defparameter hugo-url
  '(:spec-loc #P"s:/src/documentation/static/plots/"
	:data-loc #P"s:/src/documentation/static/data/"
	:data-url "/data/")
With this ‘device’, you can save a plot like so:
(vega:plot-to-device hugo-url <plot-name>)
and all the bits will be saved to their proper locations. See the
examples at the bottom of the file PLOT:SRC;VEGA;device.lisp for
various ways to use devices and the heuristics for determining
where/when/what to write. These devices have worked in practice in
generating more than 300 plots, but if you encounter a use case that’s
not covered, please open an
issue.
Vega quirks
Vega and Vega-Lite have more than their fair share of quirks and inconsistencies. For the most part you’ll only notice this in the ‘grammar’ of the graphics specification, however occasionally they may look like bugs.
When using the bin transformation, Vega-Lite assumes that if you
don’t provide the variable identifier to store the end of the bin, it
will use the name of the start of the bin, suffixed with _end. Many
of the Vega-Lite examples make this assumption. For example, this is
the snippet from a Vega-Lite example:
"data": {"url": "data/cars.json"},
  "transform": [{
      "bin": true, "field": "Horsepower", "as": "bin_Horsepwoer"
    }, {
      "aggregate": [{"op": "count", "as": "Count"}],
      "groupby": ["bin_Horsepwoer", "bin_Horsepwoer_end"]
    }, {
      "joinaggregate": [{"op": "sum", "field": "Count", "as": "TotalCount"}]
    }, {
      "calculate": "datum.Count/datum.TotalCount", "as": "PercentOfTotal"
    }
  ]
Noticed the bin is using as: bin_Horsepower and then later, in
the groupBy transformation, referring to bin_Horsepower_end. To
work around this ‘feature’, we need to specify both the start and end
for the bin operation:
:transform #((:bin t
              :field :horsepower
              :as #(:bin-horsepower :bin-horsepower-end))
                   (:aggregate #((:op :count :as :count))
                    :groupby #(:bin-horsepower :bin-horsepower-end))
This kind of behaviour may occur elsewhere, and it’s not well
documented, so just be careful when you see any kind of beginning or
end encoding in a Vega-Lite example.
Workflow
There are many possible workflows when plotting. This section describes a few that I’ve found useful when developing plots.
By default, plot will embed data in an HTML file and then call the
systems browser to open it. This is a perfectly fine way to develop plots,
especially if you’re on a machine with a good amount of RAM.
Vega-Desktop
The Vega-Desktop sadly now unmaintained, still works fine for Vega-Lite up to version 5. With this desktop application, you can drag a plot specification to the application and ‘watch’ it. Once watched, any changes you make are instantly updated in the application window. Here’s a demonstration:
First, set up a ‘device’ to use a directory on the desktop for plotting:
(defparameter vdsk1 '(:spec-loc #P"~/Desktop/plots/"
		              :data-loc #P"~/Desktop/plots/data/")
  "Put data into a data/ subdirectory")
Now send a scatterplot to this device:
(vega:plot-to-device vdsk1
  (vega:defplot hp-mpg
  `(:data (:values ,vgcars)
    :mark :point
	:encoding (:x (:field :horsepower :type :quantitative)
	           :y (:field :miles-per-gallon :type :quantitative)))))
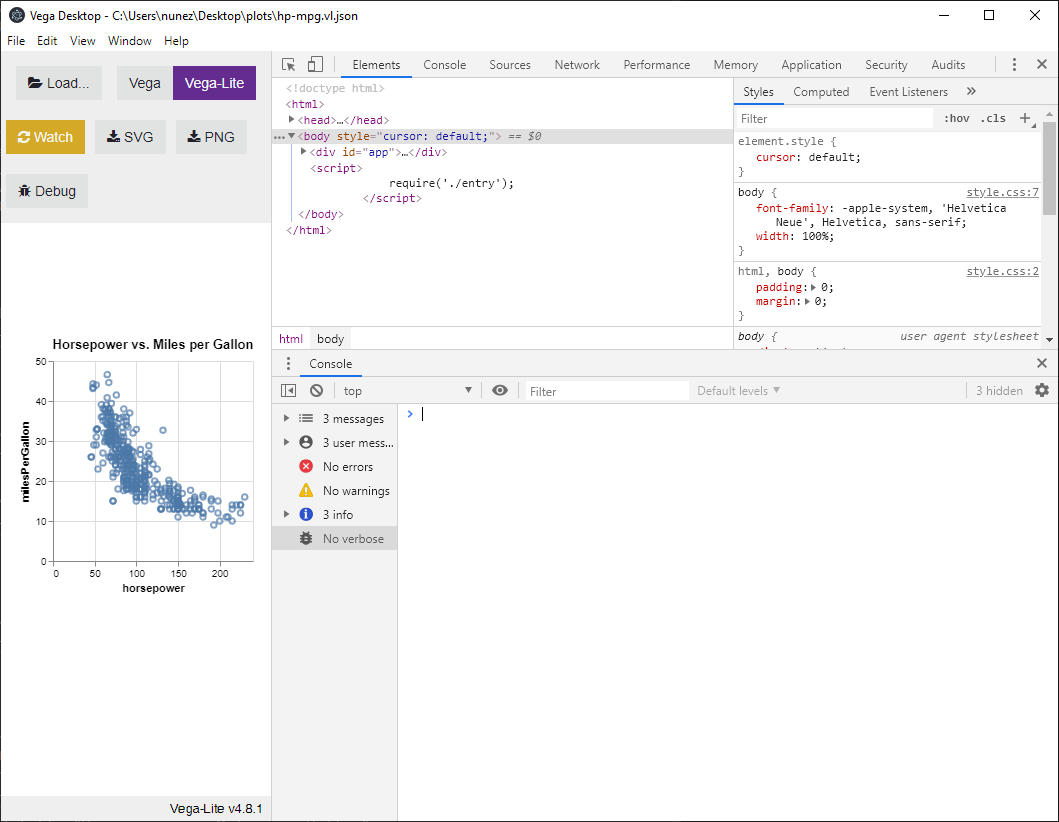
Now drag the file ~/Desktop/plots/hp-mpg.vl.json to the Vega-Desktop
application:
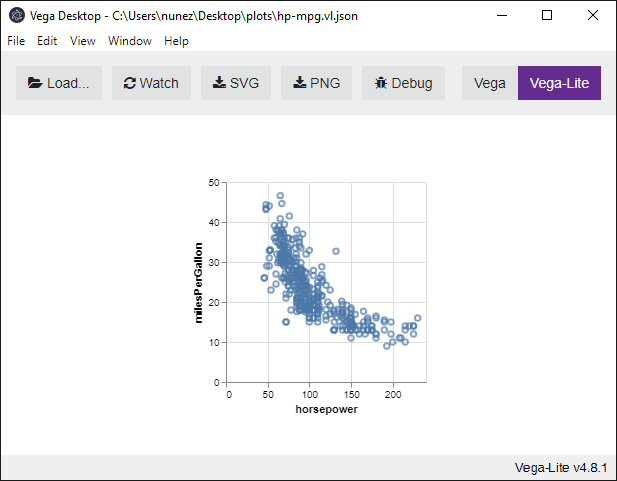
and click on the ‘watch’ button:
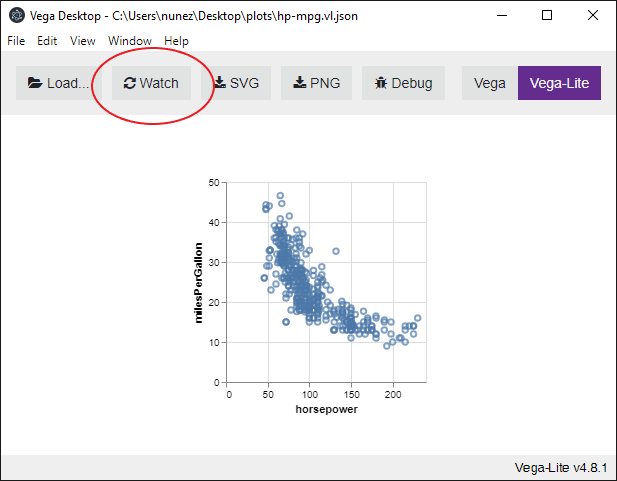
now go back to the buffer with the spec and add a title:
(vega:plot-to-device vdsk1
  (vega:defplot hp-mpg
  `(:title "Horsepower vs. Miles per Gallon"
    :data (:values ,vgcars)
    :mark :point
	:encoding (:x (:field :horsepower :type "quantitative")
	           :y (:field :miles-per-gallon :type "quantitative")))))
and reevaluate the form. If you’re in emacs, this is the C-x C-e
command. Observe how the plot is instantly updated:
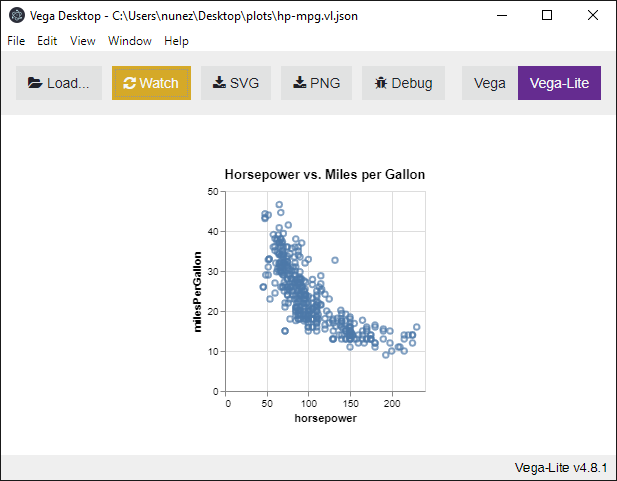
I tend to use this method when I’m tweaking a plot for final publication.
Vega edit
You can publish a plot specification to a Github gist and then invoke the Vega editor. This isn’t quite as real-time as Vega Desktop in that changes in the Lisp image aren’t automatically reflected and you’ll have to re-publish. It is a good way to debug plots and download them in various formats, or for sharing.
To use this mechanism, you’ll need to configure two environment variables so the gist wrapper will be able to use your credentials to authenticate to the Github API. Set the following environment variables to hold your github credentials:
- GITHUB_USERNAME
- GITHUB_OAUTH_TOKEN
Github no longer works with a password, so don’t bother setting that. If you want a custom scheme for authentication, you can create one by following the examples in examples/1.credentials.lisp
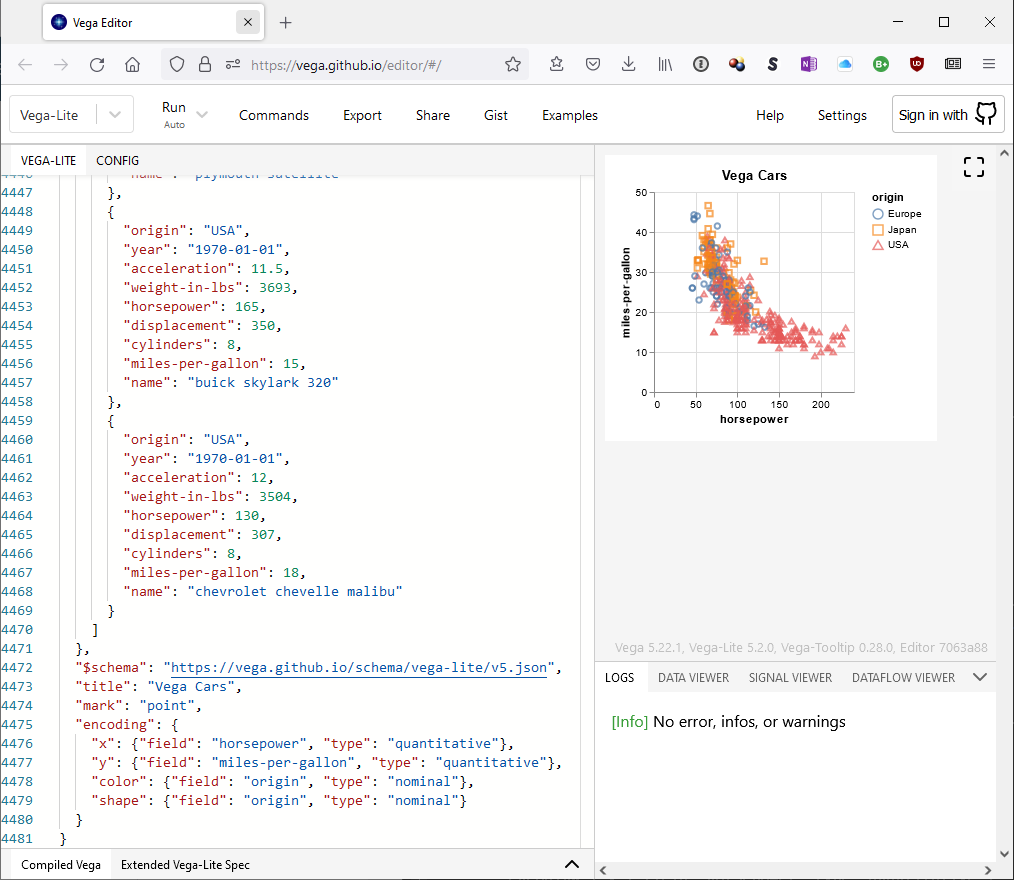
Now, you can edit the hp-mpg plot online with:
(vega:edit hp-mpg)
Debugging
There are a couple of commonly encountered scenarios when plots don’t display correctly:
- it’s so broken the browser displays nothing
- the
...button appears, but the plot is broken
Nothing is displayed
In this case, your best option is to print to a device where you can
examine the output. I use the Vega-Desktop (vgdsk1) so often it’s
part of my Lisp-Stat initialisation, and I also use it for these
cases. Once you’ve got the spec written out as JSON, see if
Vega-Desktop can render it, paying attention to the warnings.
Vega-Desktop also has a debug function:
If Vega-Desktop doesn’t help, open the file in Visual Studio code, which has a schema validator. Generally these kinds of syntax errors are easy to spot once they’re pointed out by Visual Studio.
Something is displayed
If you see the three ellipses, then you can open the plot in the online vega editor. This is very similar to Vega Desktop, but with one important difference: you can only debug plots with embedded data sets or remotely available URLs. Because the online editor is a web application hosted on Github, you can’t access local data sets. This is one reason I typically use the Vega-Desktop / Visual Studio combination.
Getting plot information
There are two ways to get information about the plots in your environment.
show-plots
The show-plots command will display the plots you have defined,
along with a description (if one was provided in the spec). Here are
the plots currently in my environment:
LS-USER> (vega:show-plots)

0: #<PLOT GROUPED-BAR-CHART: Bar chart
NIL>

1: #<PLOT HP-MPG-PLOT: Scatter plot
NIL>

2: #<PLOT HP-MPG: Scatter plot
Horsepower vs miles per gallon for various cars>
Only the last, from the example above, has a description.
describe
You can also use the describe command to view plot information:
LS-USER> (describe hp-mpg)
HP-MPG
  Scatter plot of VGCARS
  Horsepower vs miles per gallon for various cars
inspect
By typing the plots name in the emacs REPL, a ‘handle’ of sorts is returned, printed in orange:
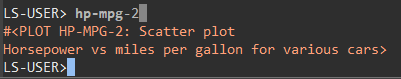
Right click on the orange text to get a context menu allowing various operations on the object, one of which is to ‘inspect’ the object.
Included datasets
The vega package includes all the data sets in the vega data
sets. They
have the same name, in the vega package, e.g. vega:penguins.
Feedback
Was this page helpful?
Glad to hear it! Please tell us how we can improve.
Sorry to hear that. Please tell us how we can improve.