This is the blog section. It has two categories: News and Releases.
Files in these directories will be listed in reverse chronological order.
This is the multi-page printable view of this section. Click here to print.
This is the blog section. It has two categories: News and Releases.
Files in these directories will be listed in reverse chronological order.
We started the year by working through the examples from the first chapter of the Introduction to the Practice of Statistics. Whilst this is an excellent test for Lisp-Stat, Chapter 2 presented some major challanges to the plotting system, so the highlight for this year is Plot 2.0. This is a breaking change, however the fix for plots is relatively simple.
The updates for 2023 include:
The examples from the first chapter of the book are now completed. This chapter focuses mostly on graphics, and the examples here supplement those in the plotting examples.
Lisp-Stat is the culmination of many months work to pull together the best-in-class statistical analysis packages available in Common Lisp, under a commercially friendly license, usable ‘out of the box’. It is an environment for statistical computing, conceptually similar to R, that is also suitable for front-line production deployments. It grew out of a desire to have an environment for rapidly prototyping analytical and A.I. solutions, and move directly to production environments with minimal friction. Typically there is a gap between the modeling environment, perhaps R or Python, and the delivery environment. Lisp-Stat closes that gap.
Lisp-Stat is in daily use for statistical analysis and is now considered ready for a broader audience.
We had a few requirements when evaluating options. Specifically the system had to:
Common Lisp was the only framework that met all these requirements. And, it is not the first time lisp has been used in a statistical setting. XLISP-STAT, our spiritual predecessor, was a contemporary of R in the early days of development. Wikipedia says about it: “XLispStat was historically influential in the field of statistical visualization” and its author, Luke Tierney, was a member of the original R core team.
Lisp-Stat provides support for vectorized mathematical operations, a super-set of common lisp array operations, and a comprehensive set of statistical methods that are implemented using the latest numerical algorithms. In addition, Common Lisp provides a dynamic programming environment that includes a REPL for interactive evaluation of code, CLOS, an excellent object oriented environment and a meta-object protocol (MOP).
We have also compiled an archive of XLISP-STAT libraries that can be ported with the aid of a compatibility package (XLS). This gives Lisp-Stat a leg up on ecosystem development; there are many useful statistical routines in the archive.
If you are familiar with R, and want to understand how to do similar things with Lisp-Stat, the basic tutorial is the place to begin. If you have a Common Lisp installation and want give Lisp-Stat a quick try, start with Install to Plot in 5 minutes. For newcomers to lisp, see the Installation section for how to get going from ground zero.
All the basics for descriptive statistical analysis.
Load the classic R mtcars data set into a data frame:
(data :mtcars)
The plotting examples show how to plot the horsepower vs. miles-per-gallon of the similar Vega-Lite data set:
(plot:plot
  (vega:defplot hp-mpg
  `(:title "Horsepower vs. MPG"
    :data (:values ,vgcars)
    :mark :point
	:encoding (:x (:field :horsepower :type :quantitative)
	           :y (:field :miles-per-gallon :type :quantitative)))))
For reproducible research and sharing.
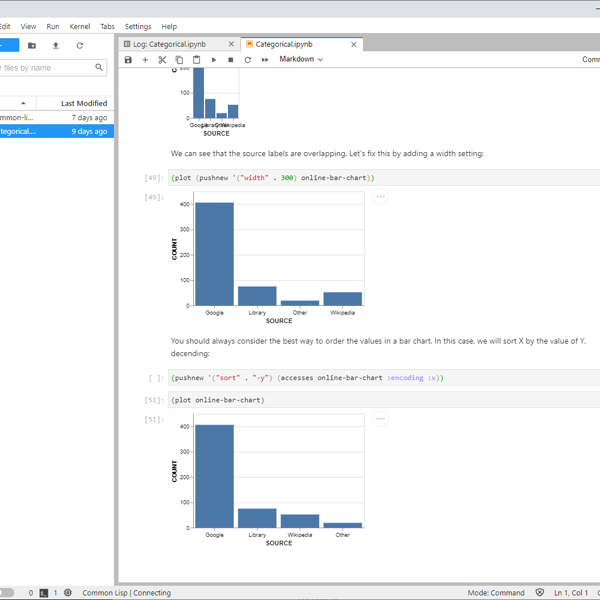
Lisp-Stat running in a Jupyter-Lab notebook
The examples show how to create commonly used statistical plots and the analytic examples work through the examples of the book Introduction to the Practice of Statistics using Lisp-Stat.
About 1500 R data sets can be
loaded using the rdata package.
The community page page describes how the project is structured. Help can be obtained from:
Several of these libraries are based on the work of Tamas K
Papp, who was working as a practicing
econometrician using Common Lisp before leaving the community for
Julia. One of the design goals for Lisp-Stat was to avoid the Lisp
Curse that
plagues so many common lisp niches, including statistics. So, rather
than reinvent the wheel, we took some existing wheels, greased and
polished them, added documentation and filed off the rough edges to
make them work smoothly together in an integrated environment. The
greenfield work includes special functions and plot.
You may have. In late March 2021 existence of Lisp-Stat was leaked to Hacker News and Reddit. At that time, we were still getting Lisp-Stat ready for general release, and things were not quite where we wanted them to be. If you saw the original leaked version, here are the changes:
This release is the third major refactoring of Lisp-Stat, with particular emphasis on plotting. I have attempted to make plotting as easy in Lisp-Stat as it is in Vega-Lite, upon which it is based. In addition, much clean-up and polishing of sharp edges has taken place as a result of using Lisp-Stat on real-world projects.
As always, comments and contributions are welcome.
(data :mtcars). The mechanism is extensible for
add on packages to use as well.(asdf:load-system :plot/vega)
(data :vgcars)
(plot:plot
(vega:defplot hp-mpg
`(:title "Horsepower vs. MPG"
:data (:values ,vgcars)
:mark :point
:encoding (:x (:field vgcars:horsepower)
:y (:field vgcars:miles-per-gallon)))))
filter-rows, remove-columns, remove-columns! and rename-column!.categorical (factor) and temporal.stack, split-apply-combine, sort operations.Array operations has been rehomed and now lives in the Lisp-Stat github organisation. Significant improvements to documentation over the previous repository.
There probably isn’t a part of the documentation that hasn’t been touched. Improvements in all areas, including organisation, expanded topic coverage and quality improvements.
Previously Lisp-Stat used semantic versioning appropiate for binary patch distribution. In this scheme the major number indicates whether or not the lisp image needed to be cold started, and a minor version indicating if a patch could be applied. Since it’s unlikely we’ll have a viable patching system in the open source Common Lisp world anytime soon, we’ve moved to semantic versioning for source releases. Since the semantics of versioning are different, all systems have been reset to 1.0.0. Going forward we’ll use the major.minor.patch scheme.